The Microarchitecture Of Bone In Osteochondromas, A Pilot Study With Micro Computed Tomography Imaging
Heleen M Staal , Wouter Nijhuis , Marianne A Witlox , Koen RJ Boom , Giovanni Paffen , S John Ham , Tim JM Welting , Bert van Rietbergen , Lodewijk W van Rhijn
Heleen M Staal1*, Wouter Nijhuis1, Marianne A Witlox1, Koen RJ Boom2, Giovanni Paffen1, S John Ham3, Tim JM Welting1, Bert Van Rietbergen2 and Lodewijk W van Rhijn1
1Department of Orthopaedic Surgery,Research school CAPHRI, Maastricht University Medical Centre, Maastricht,The Netherlands
2Department of Biomedical Engineering,Eindhoven University of Technology,Eindhoven, The Netherlands
3Department of Orthopaedic Surgery,Onze Lieve Vrouwe Gasthuis,Amsterdam, The Netherlands
- *Corresponding Author:
- Heleen M Staal
P . Debeyelaan 25 P.O. Box 5800 6202AZ
Maastricht The Netherlands
E-mail: H.staal@mumc.nl
Abstract
Osteochondromas are the most common benign bone tumors. They mostly develop in the metaphysis of long bones. Osteochondromas develop in an off-axis position and are expected to carry little mechanical loading. On clinical removal the osteochondromas appear to have a less dense, osteoporotic like, structure. There bone architecture is studied in 9 resected osteochondromas using micro-CT. The trabecular morphology is quantified and findings are compared to histological findings and to values from the literature of normal bones in the same age groups. The micro-CT shows that osteochondromas have a normal trabecular number and bone volume fraction, but the trabeculae are wider spaced and thicker than in regular trabecular bone. This study is the first to show that, compared to that of age matched controls, the microarchitecture of the osteochondromas show less but thicker trabeculae that are wider separated with a normal bone volume fraction.
Keywords
Exostosis; Osteochondroma; Micro-CT
Introduction
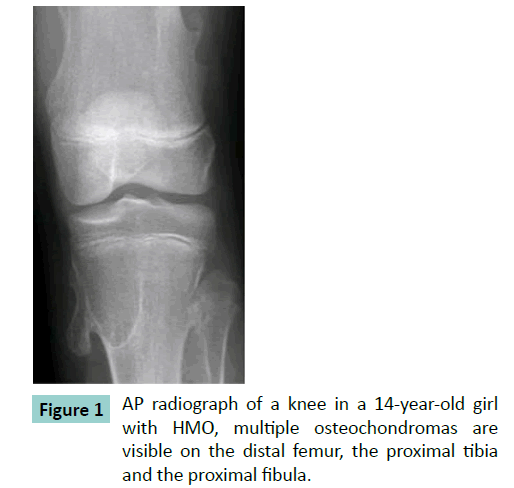
Osteochondromas are defined as a cartilage-capped bony outgrowth on the external surface of bones consisting of a marrow cavity that is continuous with that of underlying bone [1,2]. They most often occur at the metaphysisis of long bones. Osteochondromas can be single or multiple. Patients suffering from hereditary multiple osteochondromas (HMO) are known to have many osteochondromas. If the osteochondromas result in pressure on the overlying tissues patients can suffer from pain and discomfort. Osteochondromas can cause growth disturbances including madelung deformity (40-60%), unequal limb length (10- 50%) and joint deformity (2-55%) [3-5].
Histology of osteochondromas shows a strikingly consistent morphology. An osteochondroma consists of a bony stalk and a cartilaginous cap. The cap is lineated peripherally with the perichondrium, which is continuous with the periosteum of the underlying bone. The cortex of the stalk is in continuity with the cortex of the host bone, thus creating a continuous medullary cavity (Figure 1). The cap has the histological appearance of an epiphyseal growth plate with chondrocytes lined up in columns (Figure 2) [6-11]. Besides the uniform histological appearance there is a uniform biological development. The osteochondromas develop when the patient grows and cease to develop when the patient reaches skeletal maturity. No new osteochondromas develop thereafter. The lesions enlarge at a growth rate proportionate to the overall growth of the patient [7-13].
The direction of growth is pointing away from the adjacent growth plate and away from the adjacent joint. The lesion grows at an average angle of 60 degrees to the normal growth direction of the bone [10,14]. When an osteochondroma presents, it rarely spontaneously regresses during the course of childhood and puberty [7,13,15,16]. Next to the natural arising osteochondromas, investigators were able to create osteochondromas surgically by inverting a span of the ring of LaCroix [17]. These surgically created osteochondromas all disappear eventually due to spontaneous regression [17,18]. Radiographically osteochondromas appear less dense and they can fracture spontaneously [19-22]. On clinical removal the osteochondromas appear to have a less dense, osteoporotic like structure [8]. In some patients with HMO general osteoporosis is described [23].
Several topics remain unclear in the development of osteochondromas. Like why these osteochondromas do not all resorb or regress. Osteochondromas can disappear spontaneously and surgically developed osteochondromas all disappear. Why doesn’t every osteochondroma disappear eventually? Especially taking into account that all osteochondromas grow at a 60 degree angle to the bone and therefore they are not in line with the axis of the bone and do not sustain normal mechanical loading. In normal bone, non-loaded bone tissue will be resorbed if it is not sufficiently loaded [24]. It thus would be expected that osteochondromas eventually disappear as a result of osteoclast resorption [10,25]. Answers to the preservation from resorption questions might be found in the architecture of the osteochondroma. Presently, no quantitative data about the morphology of osteochondromas is available.
The aim of this research is to quantify the anatomical microstructure of osteochondromas. Because of their offaxis position it is expected that osteochondromas have a less developed, osteoporotic-like, microstructure. To investigate this, the bone morphological parameters of 9 osteochondromas were measured using micro-CT. The results were compared to histological samples and literature values.
Materials and Methods
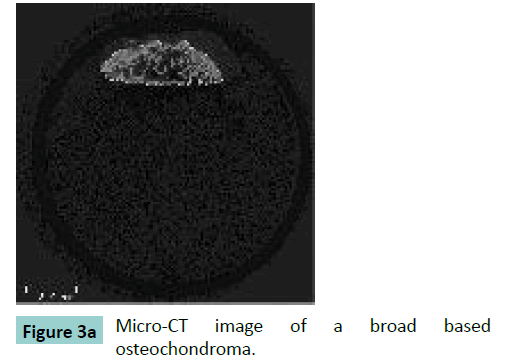
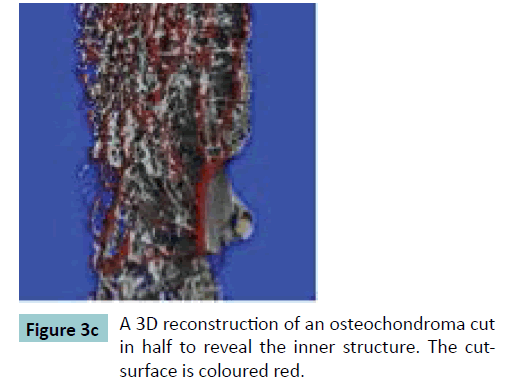
Fifteen surgically removed osteochondromas were selected. The osteochondromas were fixated in formalin. The size of the specimens varied between 15 mm up to 32 mm in length and all specimens were irregularly shaped. Micro-CT scans were performed using a vivaCT40 microCT-system (Scanco Medical, Brüttisellen, Switzerland). The specimens were scanned with an isotropic voxel size of 30 μm. The system operated at an energy level of 70 kV, and a current of 114 μA. After reconstruction, the bone was segmented from the images using a threshold of 200 per mile of the maximum value. The structural properties of each specimen were evaluated using the micro-CT system software. Contours were drawn to delineate the region of the osteochondroma in the scan (Figure 3). For the first slice this was done manually thereafter the system automatically determines the contouring of the next slices. When the automatic contouring deviated from the bony contour, the operator manually adjusted the contour.
Of the fifteen samples only the samples with a total volume larger than 100 mm3 and a calcified size (bone not cartilage) of at least 4 by 4 by 4 mm were selected for evaluation because morphological measurements in smaller samples would be inaccurate. Therefore 6 samples were excluded. The 9 samples for evaluation were derived from 6 different patients. The patients (4 females, 2 males) varied in age from 4 years up to 16 years (mean age 9 years). The places of origin of the osteochondromas were the distal ulna (n=2), the scapula (n=2) and the knee (n=5). Of these nine samples the following parameters were quantified: volume fraction (BV/TV), trabecular separation (Tb.Sp, μm), trabecular number (Tb.N, mm-1), trabecular thickness (Tb.Th, μm), mean density of the bone tissue volume (MDBV, mg HA/ ml), the mean density of the total volume (MDTV, mg HA/ml) and the degree of anisotropy (DA). The mean trabecular thickness, separation and number of cancellous bone were calculated using direct 3D measure and are denoted here as Tb.Th*, Tb.Sp* and Tb.N* respectively [26-28]. In order to compare our values with literature values trabecular thickness, spacing and number were also evaluated using the plate model assumption and in that case denoted as Tb.Th#, Tb.Sp# and Tb.N# respectively. The DA was defined as the ratio of the largest over the smallest eigenvalue of the Mean Intercept Length fabric tensor.
For a subset of 5 samples histology was performed to identify the cartilage on top of the osteochondromas. The samples were embedded in plastic, polymethylmethacrylate (PMMA, Technovit 9100, Hereaus-Kulzer, Germany). After polymerization, sections were stained according to Masson Goldner (Carl Roth, Germany) to clearly identify the trabeculae and the cartilage cap. Thereafter 50 μm sections were generated using a saw microtome (SP 1600, Leica, Germany). Sections were analyzed and digitized by light microscopy (Axioscope A1, AxioVision LE release 4.8.2, Carl Zeiss, Germany). The central two slices were selected and in each slice 10 trabeculae were randomly selected and their thickness was measured.
To compare the outcome of the values from the osteochondromas a literature search was performed for bone parameters in normal children and adolescents. Four different articles on bone architecture were selected on the basis of the age group of the patients [29-32]. This selection was made because the osteochondromas were retrieved from children and adolescents. Adolescent bone has a different microarchitecture compared to adult cancellous bone with a lower bone surface density, a greater trabecular separation and a lower trabecular number than adult bone [30]. These literature studies involved bone taken from different sites: tibia, the non-dominant radius and the iliac-crest.
Approval of the local ethic committee was received for this protocol in May 2008, number MEC 08-4-028. An informed consent was obtained from all patients or their parents.
Results
Micro-CT scanning results show a broad variation in bone morphology for the different specimens, Coefficient of Variation (CV) values varying between 29% and 49% (Table 1). In spite of the large variation in structural parameters (Tb.Sp, Tb.N, Tb.Th,) the bone tissue mineralisation varied only in a very limited range with a CV of 2.
Histology
All specimens showed a histological image identical to the known structure of an osteochondroma. A cartilage cap was visible as well as a trabecular configuration of bone. The average height of the cartilage cap was 1557 μm (SD 738 μm) with a range from 572 to 2424 μm. The thickest cap was found in the sample from the youngest patient. All specimens showed a clear inter digitation from cartilage and the trabecular bone. The transition zone was irregularly shaped. The results of the trabecular thickness measurements are shown in Table 1. The trabecular thickness found in the selected trabeculae varies widely. The mean of trabecular thickens is higher than the values from the Micro-CT scans, but there are outliers on both sides of the spectrum.
| Parameter | Mean | Median | SD | Minimum – Maximum | CV (%) |
|---|---|---|---|---|---|
| BV/TV [%] | 18 | 17 | 7 | 11- 33 | 39 |
| Tb.Sp* [µm] | 1254 | 1330 | 612 | 528 – 2412 | 49 |
| Tb.N* [mm-1] | 1.01 | 0.91 | 0.48 | 0.48 - 1.88 | 48 |
| Tb.Th* [µm] | 305 | 280 | 115 | 153 – 578 | 38 |
| Tb.Sp# [µm] | 989 | 1061 | 287 | 303 – 1332 | 29 |
| Tb.N# [mm-1] | 0.94 | 0.84 | 0.46 | 0.58 - 2.15 | 49 |
| Tb.Th# [µm] | 205 | 194 | 72 | 132 – 382 | 35 |
| DA [-] | 1.52 | 1.29 | 0.40 | 1.23 - 2.43 | 26 |
| MDBV [mg HA/ml] | 784.53 | 787.43 | 17.04 | 764.06 - 811.82 | 2 |
| MDTV [mg HA/ml] | 158.57 | 138.90 | 64.66 | 91.04 - 297.30 | 41 |
| Tb.Th histology [µm] | 543 | 632 | 158 | 22 – 3342 | 29 |
Table 1: The Median, mean, standard deviation and the range of the values of the structural parameter (*direct 3D measure, # plate model). The values of the histological specimens are shown in the last line.
Values in literature
The first author, the patients age group, the sites of the study and the values of the bone parameters are listed in Table 2. The values for 3D and plate model parameters are listed separately when available. The volume fraction values in all groups are comparable to the volume fraction found in our study, indicating that the osteochondromas have a bone volume fraction comparable to that of normal subjects in the same age group. The trabecular separation in the osteochondromas, however, is almost double that of the separation found in normal bone. Further the microarchitecture of the osteochondromas shows a relatively low trabecular number and a high trabecular thickness. As for the degree of anisotropy (DA) there was only one comparative study [30] with an almost identical DA. In their study, however, samples of the proximal tibia of cadaver bones of children were measured.
| Author | Burrows | Zhu | Zhu | Ding | Kirmani | Staal |
|---|---|---|---|---|---|---|
| Age | 15-20 | 12-19 | 12-19 | 9-17 | 6-21 | 4-16 |
| Site | Tibia | Iliac crest | Iliac crest | Tibia | Radius | Osteochondroma |
| Imaging | HR-pQCT | Micro-CT | Micro-CT | Micro-CT | HR- pQCT | Micro-CT |
| Resolution (µm) | 82 | 40 | 40 | 40 | 82 | 30 |
| N | 278 | 15 | 16 | 6 | 127 | 9 |
| BV/TV (%) | 15 | 20 | 19 | 20 | 16 | 18 |
| TB.N*(mm-1) | 1.75 | 1.81 | - | 1.37 | 2.0 | 1.01 |
| Tb.Th*(µm) | 91 | 156 | - | 187 | 80 | 305 |
| Tb.Sp*(µm) | 490 | 552 | - | 735 | 440 | 1254 |
| TB.N# (mm-1) | - | - | 1.9 | - | - | 0.94 |
| Tb.Th# (µm) | - | - | 104 | - | - | 205 |
| Tb.Sp# (µm) | - | - | 479 | - | - | 989 |
| DA (-) | 1.54 | 1.52 |
Table 2: Mean values for the structural parameters for the different groups.
Discussion
Using micro-CT the microarchitecture of osteochondromas from HMO-affected children was determined. In this pilot study the microarchitecture shows thicker and wider spaced trabeculae with a relatively normal trabecular number and a normal bone volume fraction when compared to normal bone of children in the same age range. In spite of the large variation in structural parameters, the bone tissue mineralisation varied only in a very limited range, suggesting that the biological processes that lead to mineralisation are not affected. The origin of thicker and wider spaced trabeculae of an osteochondroma might be explained by the presence of the cartilage cap on top of the osteochondroma. In HMO patients the organization of chondrocytes in the epiphysis, specifically that of the columnar structures, has been lost, suggesting changes in cell adhesion and motility and related cell–matrix and cell–cell communication mechanisms [33]. The cartilage cap has a similar structure to an epiphysis. It consists of separated clusters of cartilage cells in columns, similar to a lobbed epiphysis. The cartilage cap chondrocytes are separated in different cell clusters. These separated clusters eventually mineralize and if each cluster of chondrocyte cells produces their own set of trabeculae, it might lead to thicker and wider spaced trabeculae.
Besides the cartilage cap-architecture, the cap can also have a biological/paracrine effect on the bone below it, by influencing the activity of bone remodelling [18]. In HMO the exostosin (EXT) genes are involved, leading to a heparan sulfate deficiency influencing growth plate-associated signaling proteins [33-35]. Sgariglia and colleagues described a significantly larger number of osteoclasts and deranged trabecular bone formation in both extent and cell composition in Ext1 deficient mice [36]. The abnormal biological environment lacking heparan sulfate and influencing the osteoclasts, amongst others, is expected to disturb the normal bone remodelling influencing the microarchitecture. The observed increased trabecular spacing may be responsible for the clinical appearance of an osteoporotic-like structure of the removed osteochondromas [8]. The wider spaced trabeculae giving it a visual osteoporotic appearance. Possibly these thicker but wider spaced trabeculae can carry less load and occasionally break, explaining the spontaneous fractures [19-22].
The histology showed the cartilage cap and the bony structures, the typical build of an osteochondroma. The measured trabeculae were on average thicker than the micro-CT values (Table 1), but the measurements had a wider variation (Tb.Th micro-CT average 205 μm plate model, variation 132-382, CV 35 and Tb.Th histology average 543 μm, variation 22-3342, CV 29). This might be due to the selection procedure. The selected histological slices were all evaluated in the transition zone between the cartilage and the bone formation. The micro-CT measurements were done in the complete osteochondroma and not only in the transition zone. In the transition zone the trabeculae originate and might therefore be more variable in size. Also this zone shows multiple fine indentations just below the cartilage cap and might therefore not be well presented in the micro-CT measurements.
This pilot study sets a first step in elaborating the architectural properties of osteochondromas.
However there are limitations. Of the initial 15 samples 6 were not calcified enough, leaving only a small number for evaluation. The age of the patients of the evaluated samples varied widely as did the place of origin. There is not enough reference to compare the findings to normal bone in these age groups and there are no values to compare the osteochondromas to. For all determined parameters more research is needed with a greater specimen population to confirm the outcomes. Future studies with Extreme CT evaluation can be performed on osteochondromas in vivo in order to compare the osteochondroma bone morphology to the morphology of the adjacent long bone and to study the trabecular osteochondroma development in time.
To our knowledge this is the first study done with micro-CT derived data and human osteochondromas for this purpose.
Conclusion
This study is the first to show that, compared to that of age matched controls, the microarchitecture of the osteochondromas show less but thicker trabeculae that are wider separated with a normal bone volume fraction. The microarchitecture only resembles an osteoporotic structure in some aspects (increased trabecular spacing, decreased trabecular number). The structure may be due to the biological influence of the cartilage cap nearby.
Author’s contribution
HS, WN, KB and BR were responsible for the study design, HS, AW, GP, JH, TW, and LR collected and selected the samples, HS, KB and BR collected the data, HS and KB wrote the first draft, all authors approved the last version before submission.
Conflict of interest
Bert van Rietbergen works as a consultant for Scanco Medical, Switzerland. No funding was received for this research.
References
- Khurana J, F. FA-K, Bovee J (2002) Osteochondroma. World Health Organisation Classification of tumours Pathology and Genetics of Tumours of Soft Tissue and Bone 234-236.
- Bovee J, Hogendoorn PC (2002) Multiple Osteochondromas. World Health Organisation Classification of tumours Pathology and Genetics of Tumours of Soft Tissue and Bone: 260-362.
- Schmale GA, Conrad EU 3rd, Raskind WH (1994) The natural history of hereditary multiple exostoses. J Bone Joint Surg Am 76: 986-992.
- Legeai-Mallet L, Munnich A, Maroteaux P, Le Merrer M (1997) Incomplete penetrance and expressivity skewing in hereditary multiple exostoses. Clin Genet 52: 12-16.
- Wicklund CL, Pauli RM, Johnston D, Hecht JT (1995) Natural history study of hereditary multiple exostoses. Am J Med Genet 55: 43-46.
- .Peterson HA (1989) Multiple hereditary osteochondromata. Clin Orthop Relat Res : 222-230.
- Peterson HA (1989) Multiple hereditary osteochondromata. Clin Orthop Relat Res : 222-230.
- Hennekam RC (1991) Hereditary multiple exostoses. J Med Genet 28: 262-266.
- Kitsoulis P, Galani V, Stefanaki K, Paraskevas G, Karatzias G, et al. (2008) Osteochondromas: review of the clinical, radiological and pathological features. In Vivo 22: 633-646.
- Hameetman L, Bovee JV, Taminiau AH, Kroon HM, Hogendoorn PC (2004) Multiple osteochondromas: clinicopathological and genetic spectrum and suggestions for clinical management. Hered Cancer Clin Pract 2: 161-173.
- Milgram JW (1983) The origins of osteochondromas and enchondromas. A histopathologic study. Clin Orthop Relat Res : 264-284.
- Huegel J, Sgariglia F, Enomoto-Iwamoto M, Koyama E, Dormans JP, et al. (2013) Heparan sulfate in skeletal development, growth, and pathology: the case of hereditary multiple exostoses. Dev Dyn 242: 1021-1032.
- Bovée JV (2008) Multiple osteochondromas. Orphanet J Rare Dis 3: 3.
- SOLOMON L (1964) HEREDITARY MULTIPLE EXOSTOSIS. Am J Hum Genet 16: 351-363.
- Vanhoenacker FM, Van Hul W, Wuyts W, Willems PJ, De Schepper AM (2001) Hereditary multiple exostoses: from genetics to clinical syndrome and complications. Eur J Radiol 40: 208-217.
- Hoshi M, Takami M, Hashimoto R, Okamoto T, Yanagida I, et al. (2007) Spontaneous regression of osteochondromas. Skeletal Radiol 36: 531-534.
- Yanagawa T, Watanabe H, Shinozaki T, Ahmed AR, Shirakura K, et al. (2001) The natural history of disappearing bone tumours and tumour-like conditions. Clin Radiol 56: 877-886.
- Hoshi M, Takami M, Hashimoto R, Okamoto T, Yanagida I, et al. (2007) Spontaneous regression of osteochondromas. Skeletal Radiol 36: 531-534.
- Delgado E, Rodríguez JI, Rodríguez JL, Miralles C, Paniagua R (1987) Osteochondroma induced by reflection of the perichondrial ring in young rat radii. Calcif Tissue Int 40: 85-90.
- Trebicz-Geffen M, Nevo Z, Evron Z, Posternak N, Glaser T, et al. (2003) The short-lived exostosis induced surgically versus the lasting genetic hereditary multiple exostoses. Exp Mol Pathol 74: 40-48.
- Henry NE, Carow SD, Kocher BL (2014) Osteochondroma fracture at the distal medial femur. J Orthop Sports Phys Ther 44: 457.
- Kanauchi T, Suganuma J, Kawasaki T, Mochizuki R, Inoue Y, et al. (2012) Fracture of an osteochondroma of the femoral neck caused by impingement against the ischium. Orthopedics 35: e1438-1441.
- Kose O, Ertas A, Celiktas M, Kisin B (2009) Fracture of an osteochondroma treated successfully with total excision: two case reports. Cases J 2: 8062.
- Theodorou SD, Karamitsos S, Tsouparopoulos D, Hatzipavlou AG (1978) Rare complications of exostosis. Fractures and injury to the common peroneal nerve. Acta Orthop Belg 44: 496-505.
- Lemos MC, Kotanko P, Christie PT, Harding B, Javor T, et al. (2005) A novel EXT1 splice site mutation in a kindred with hereditary multiple exostosis and osteoporosis. J Clin Endocrinol Metab 90: 5386-5392.
- Wolff J (1986 (translation of the German 1892 edition)) "The Law of Bone Remodeling" Berlin Heidelberg New York: Springer
- Chin KR, Kharrazi FD, Miller BS, Mankin HJ, Gebhardt MC (2000) Osteochondromas of the distal aspect of the tibia or fibula. Natural history and treatment. J Bone Joint Surg Am 82: 1269-1278.
- Adams JE (2009) Quantitative computed tomography. Eur J Radiol 71: 415-424.
- Gasser JA, Ingold P, Grosios K, Laib A, Hämmerle S, et al. (2005) Noninvasive monitoring of changes in structural cancellous bone parameters with a novel prototype micro-CT. J Bone Miner Metab 23 Suppl: 90-96.
- Chappard C, Marchadier A, Benhamou L (2008) Interindividual and intraspecimen variability of 3-D bone microarchitectural parameters in iliac crest biopsies imaged by conventional micro-computed tomography. J Bone Miner Metab 26: 506-513.
- Burrows M, Liu D, McKay H (2010) High-resolution peripheral QCT imaging of bone micro-structure in adolescents. Osteoporos Int 21: 515-520.
- Ding M, Danielsen CC, Hvid I, Overgaard S (2012) Three-dimensional microarchitecture of adolescent cancellous bone. Bone 51: 953-960.
- Kirmani S, Christen D, van Lenthe GH, Fischer PR, Bouxsein ML, et al. (2009) Bone structure at the distal radius during adolescent growth. J Bone Miner Res 24: 1033-1042.
- Zhu F, Qiu Y, Yeung HY, Lee KM, Cheng CY (2009) Trabecular bone micro-architecture and bone mineral density in adolescent idiopathic and congenital scoliosis. Orthop Surg 1: 78-83.
- de Andrea CE, Wiweger M, Prins F, Bovée JV, Romeo S, et al. (2010) Primary cilia organization reflects polarity in the growth plate and implies loss of polarity and mosaicism in osteochondroma. Lab Invest 90: 1091-1101.
- Benoist-Lasselin C, de Margerie E, Gibbs L, Cormier S, Silve C, et al. (2006) Defective chondrocyte proliferation and differentiation in osteochondromas of MHE patients. Bone 39: 17-26.
Open Access Journals
- Aquaculture & Veterinary Science
- Chemistry & Chemical Sciences
- Clinical Sciences
- Engineering
- General Science
- Genetics & Molecular Biology
- Health Care & Nursing
- Immunology & Microbiology
- Materials Science
- Mathematics & Physics
- Medical Sciences
- Neurology & Psychiatry
- Oncology & Cancer Science
- Pharmaceutical Sciences


